In the last two posts (
part 1,
part 2) in this series we used PowerShell to gleam information from our monthly AWS billing report. While you can use those scripts to learn a great amount of information from about your AWS usage, you will eventually outgrow PowerShell. In this post I will show you how to load the bill into SQL Server for more detailed analysis.
In the prior posts we used the monthly reports. These reports contain a single line item for each resource for the entire month. In this post we are going to use the hourly report. This report shows the detailed expenses incurred each hour. If you shut a machine down at night you will see that reflected in the report.
Creating a Staging Schema
The first step is to create a table in SQL Server to hold the data. I am calling this a staging table because this post will present a star schema for a data warehouse. But, you could simply use this one table and run reports directly against it.
AWS does not have a lot of detail on the schema for the billing reports. I have been using the following table schema for about a year now and have worked out most of the kinks. Some of my fields are likely larger than needed, but since my data eventually I end up in a star schema, I prefer to have a little buffer. Also note that I am using consolidated billing, but I am ignoring the
blended rates. If you wanted to add blended rates, a real should suffice.
 1
 2
 3
 4
 5
 6
 7
 8
 9
10
11
12
13
14
15
16
17
18
19
20
21
22
23
24
25
26
|
CREATE TABLE [dbo].[StageLineItems](
 [ReportFileName] [nvarchar](256) NOT NULL,
 [InvoiceID] [varchar](16) NOT NULL,
 [PayerAccountId] [bigint] NOT NULL,
 [LinkedAccountId] [bigint] NOT NULL,
 [RecordType] [varchar](16) NOT NULL,
 [RecordID] [decimal](26, 0) NOT NULL,
 [ProductName] [varchar](64) NOT NULL,
 [RateId] [int] NOT NULL,
 [SubscriptionId] [int] NOT NULL,
 [PricingPlanId] [int] NOT NULL,
 [UsageType] [varchar](64) NOT NULL,
 [Operation] [varchar](32) NOT NULL,
 [AvailabilityZone] [varchar](16) NULL,
 [ReservedInstance] [char](1) NOT NULL,
 [ItemDescription] [varchar](256) NOT NULL,
 [UsageStartDate] [datetime] NOT NULL,
 [UsageEndDate] [datetime] NOT NULL,
 [UsageQuantity] [real] NOT NULL,
 [Rate] [real] NOT NULL,
 [Cost] [real] NOT NULL,
 [ResourceId] [varchar](128) NULL,
 [user:Name] [varchar](256) NULL,
 [user:Owner] [varchar](256) NULL,
 [user:Project] [varchar](256) NULL
)
|
Loading the Data
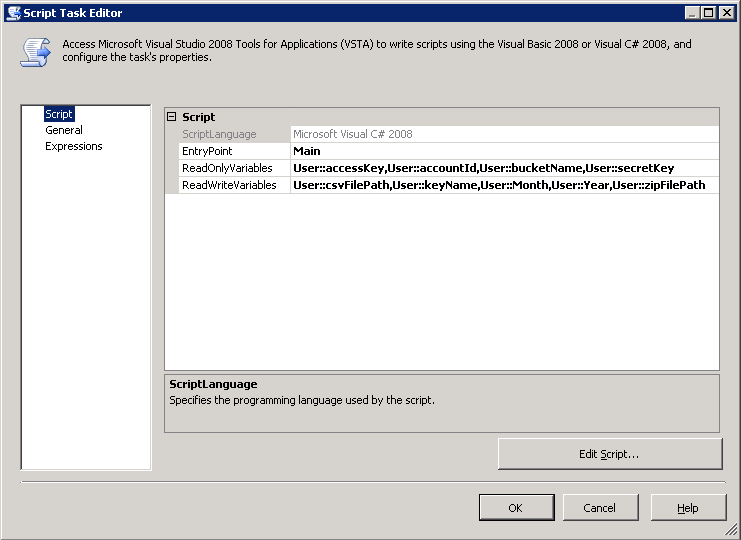
Once you have the table created you will need to load the report. I use an SSIS job for this. I am loading the "Detailed Line Items with Resources and Tags" report. This is the most detailed report available. I created a custom script task in SSIS to download the report from S3. This package runs every six hours to refresh the data in the warehouse.
My script expects the account id, bucket name, access key, and secret key. In addition, you can optional specify the month, year and file name. If you don't specify the optional params, the script will calculate the current month and return it do you can use it later in the package. See below.
The code for my script task is below. It calculates the dates and then uses the AWS .Net API to download the file. Note that you must GAC AWSSDK.dll before SSIS will load it.
 1
 2
 3
 4
 5
 6
 7
 8
 9
10
11
12
13
14
15
16
17
18
19
20
21
22
23
24
25
26
27
28
29
30
31
32
33
34
35
36
37
38
39
40
41
42
43
44
45
46
47
48
49
50
51
52
53
54
55
56
57
58
59
60
61
62
63
64
65
66
67
68
69
70
71
72
73
74
75
|
using System;
using System.Data;
using Microsoft.SqlServer.Dts.Runtime;
using System.Windows.Forms;

using Amazon;
using Amazon.S3;
using Amazon.S3.Model;
using System.IO;

namespace ST_a8746170d9b84f1da9baca053cbdc671.csproj
{
    [System.AddIn.AddIn("ScriptMain", Version = "1.0", Publisher = "", Description = "")]
    public partial class ScriptMain : Microsoft.SqlServer.Dts.Tasks.ScriptTask.VSTARTScriptObjectModelBase
    {
        #region VSTA generated code
        enum ScriptResults
        {
            Success = Microsoft.SqlServer.Dts.Runtime.DTSExecResult.Success,
            Failure = Microsoft.SqlServer.Dts.Runtime.DTSExecResult.Failure
        };
        #endregion

        public void Main()
        {
            string accountId = (string)Dts.Variables["accountId"].Value;
            string accessKey = (string)Dts.Variables["accessKey"].Value;
            string secretKey = (string)Dts.Variables["secretKey"].Value;
            string bucketName = (string)Dts.Variables["bucketName"].Value;

            System.DateTime date = DateTime.Now.AddDays(-5);
            int month = (int)Dts.Variables["Month"].Value;
            if (month == 0) { month = date.Month; }
            int year = (int)Dts.Variables["Year"].Value;
            if (year == 0) { year = date.Year; }

            try
            {
                string keyName = string.Format("{0}-aws-billing-detailed-line-items-with-resources-and-tags-{1:0000}-{2:00}.csv.zip", accountId, year, month);
                Dts.Variables["keyName"].Value = keyName;

                string zipFilePath = Path.Combine(Path.GetTempPath(), keyName);
                Dts.Variables["zipFilePath"].Value = zipFilePath;

                string csvFilePath = zipFilePath.Replace(".zip", "");
                Dts.Variables["csvFilePath"].Value = csvFilePath;

                    AmazonS3Config config = new AmazonS3Config()
                    {
                        ServiceURL = "s3.amazonaws.com"
                    };

                    using (IAmazonS3 client = Amazon.AWSClientFactory.CreateAmazonS3Client(accessKey, secretKey, RegionEndpoint.USEast1))
                    {
                        GetObjectRequest request = new GetObjectRequest()
                        {
                            BucketName = bucketName,
                            Key = keyName
                        };

                        using (GetObjectResponse response = client.GetObject(request))
                        {
                            if (File.Exists(zipFilePath)) File.Delete(zipFilePath);
                            response.WriteResponseStreamToFile(zipFilePath);
                        }
                    }
                    Dts.TaskResult = (int)ScriptResults.Success;
            }
            catch (AmazonS3Exception amazonS3Exception)
            {
                Dts.TaskResult = (int)ScriptResults.Failure;
            }
        }
    }
}
|
Notice that the report we are downloading is a .zip file. The detailed report can get very large. I am simply shelling out to 7Zip from the SSIS package to decompress the report. Finally, note that the report contains a few summary lines you will likely want to exclude from the report when you load. I use the following filter.
1
|
RecordType == "LineItem" && RateId != 0 && !ISNULL(RecordId)
|
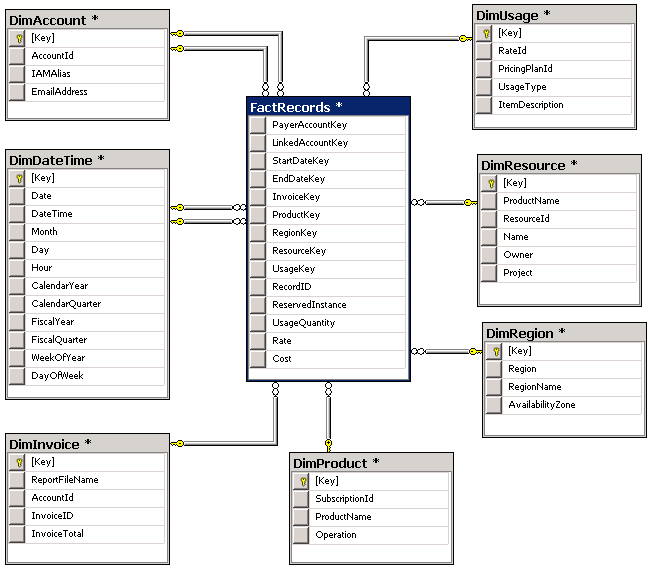
Star Schema
The final piece of the puzzle is loading the data into a warehouse for reporting. I'm not going to take you through the details of designing a data warehouse, but I can share the schema I am using. I analyzed the data a few times using a Data Profiling Task, and ultimately settled on the following dimension tables
I hope this series has been helpful.

